Weekly Market Commentary
May 18th, 2026
Week in Review
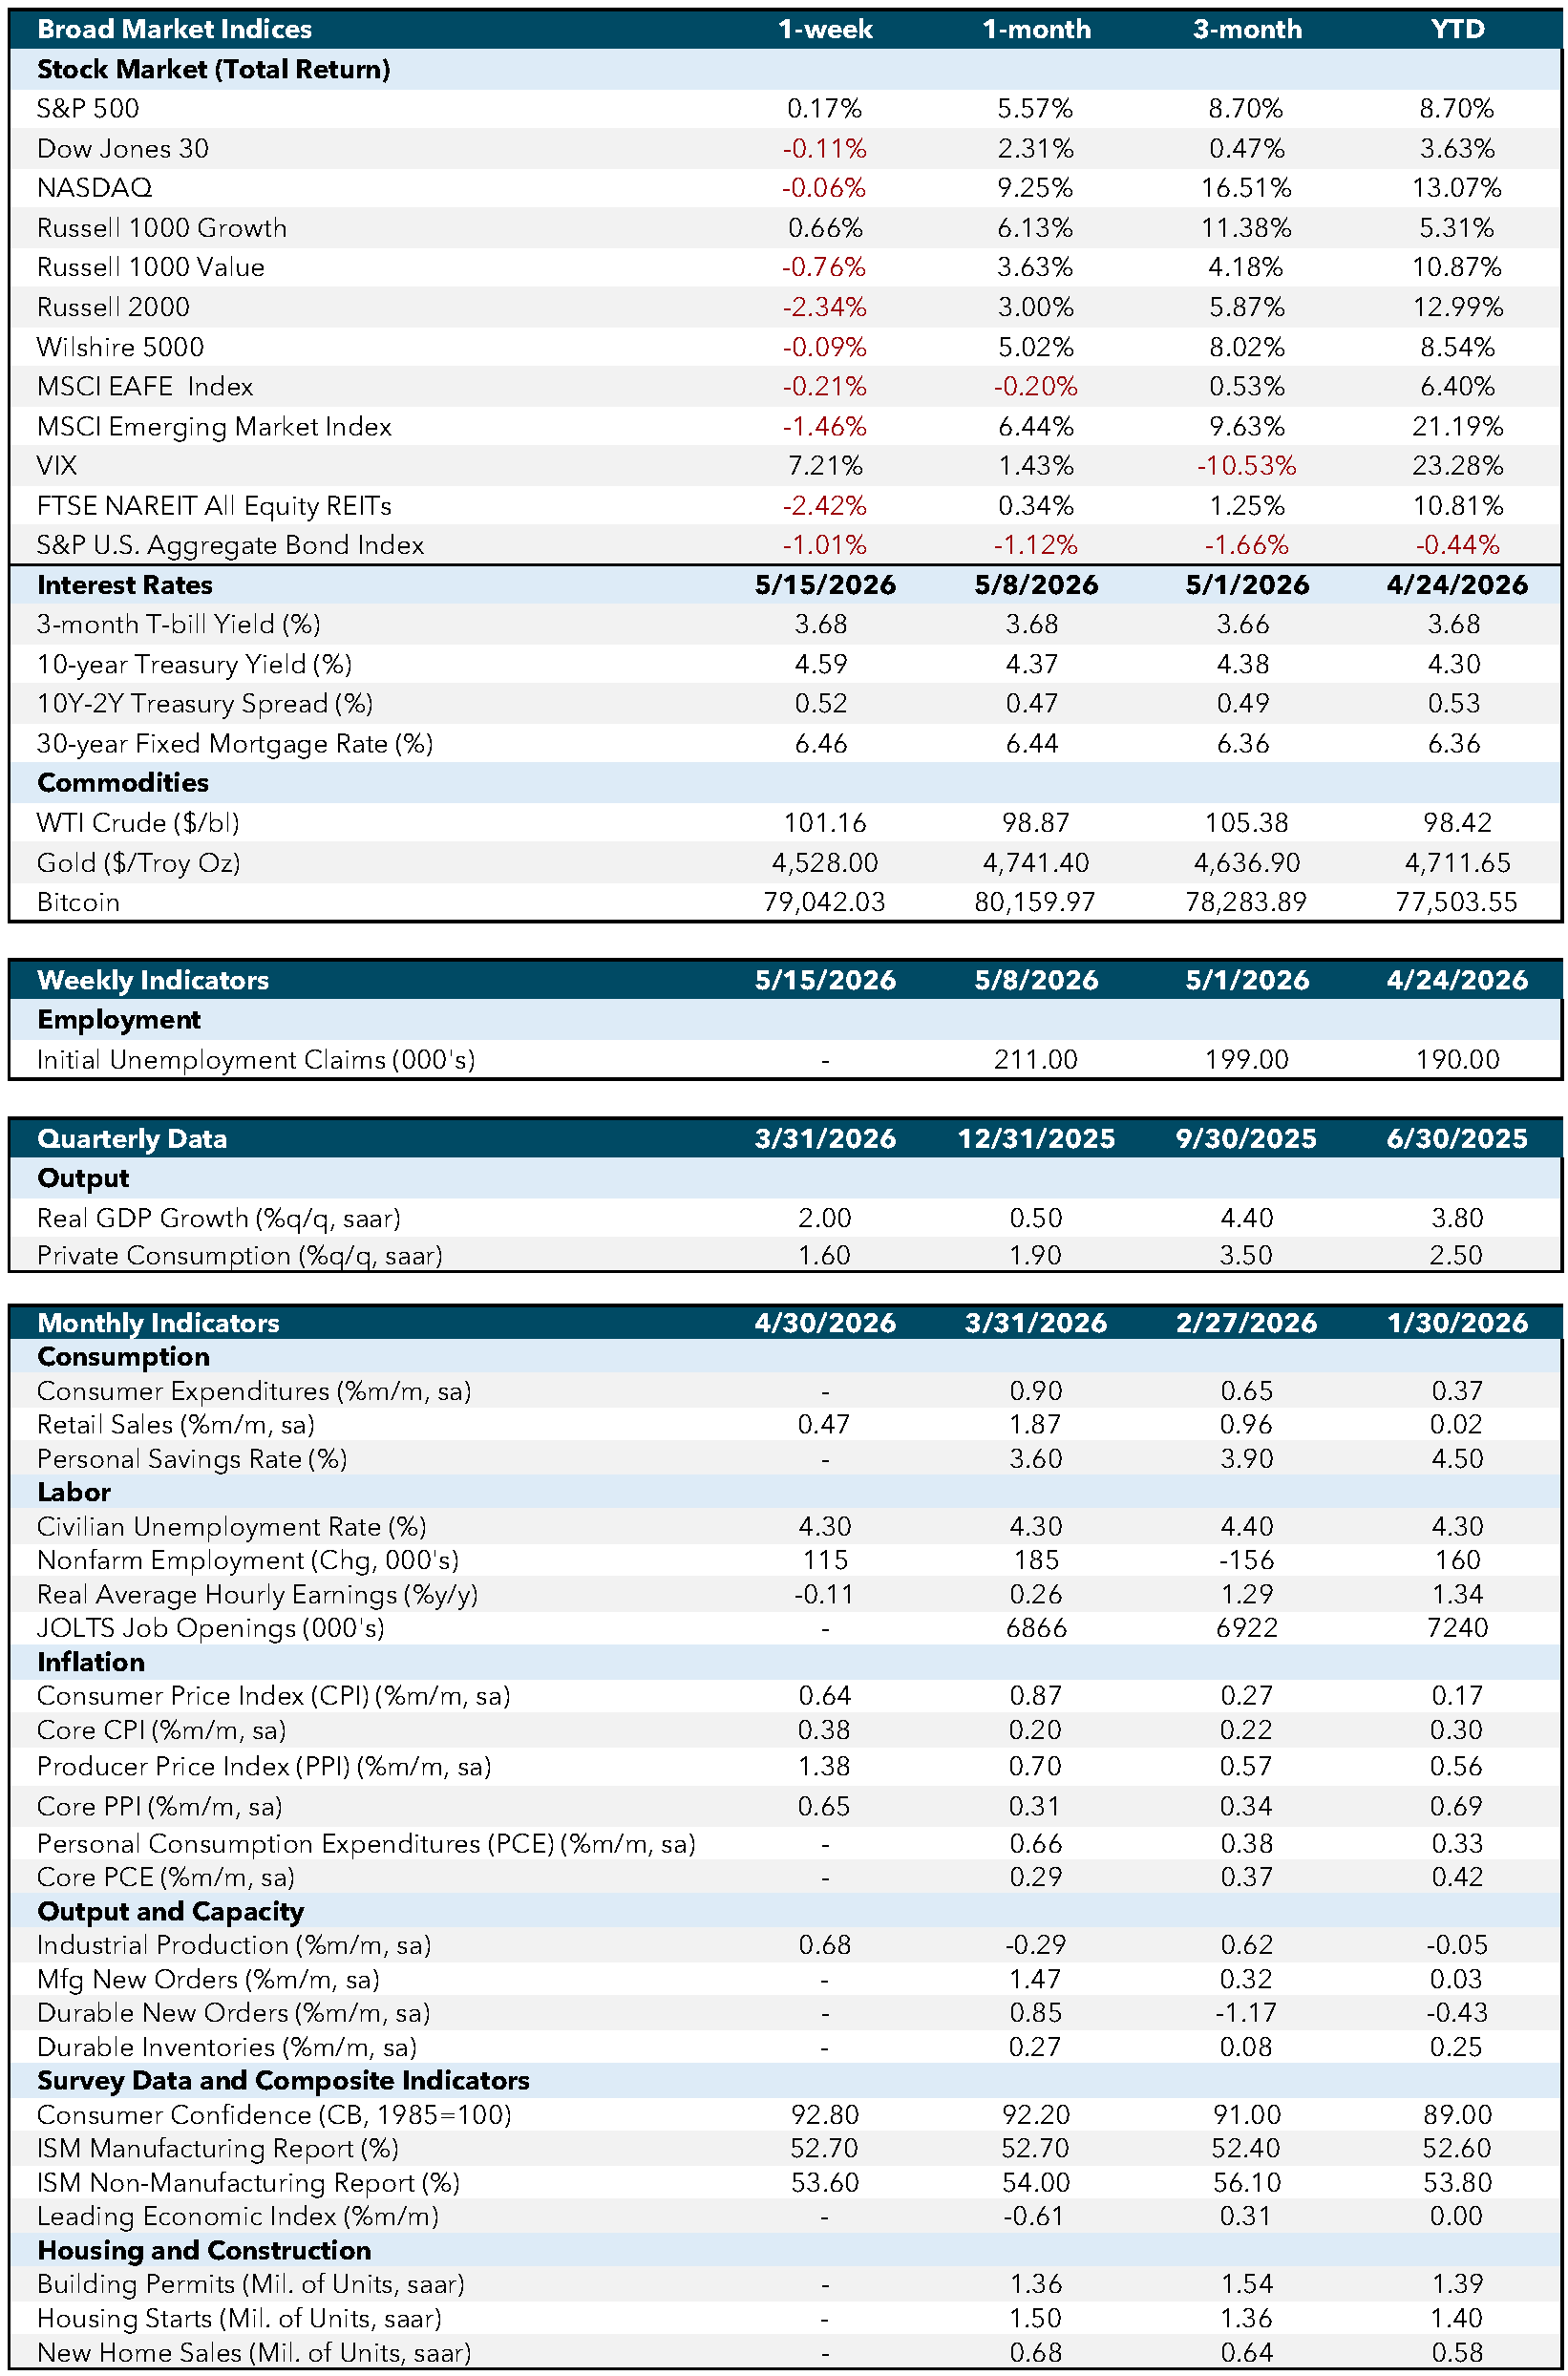
Last week was centered on inflation and consumer demand, with housing and labor data helping round out the broader economic picture.
Inflation data leaned to the upside overall, particularly at the core and producer levels. Core Consumer Price Index (CPI) rose 0.4% month-over-month in April, above expectations of 0.3% and accelerating from the prior 0.2%, indicating underlying inflation remains sticky. Headline CPI increased 0.6%, in line with expectations but below the prior 0.9%, while year-over-year CPI rose to 3.8% versus 3.7% expected. Progress toward the Fed’s target continues, though at an uneven pace. More notably, the Producer Price Index (PPI) surprised significantly to the upside at 1.4% month-over-month versus a 0.5% forecast, pointing to building upstream cost pressures that could feed into future consumer prices.
Consumer demand remained resilient but showed signs of normalization. Retail sales rose 0.5% month-over-month, matching expectations but slowing from the prior 1.6%, while core retail sales increased 0.7%, also in line but well below the prior 1.9%. The data suggest consumers are still spending, though momentum has moderated from earlier strength.
Elsewhere, labor and housing data pointed to stability with some modest softening at the margins. Initial jobless claims came in at 211,000 versus 205,000 expected, ticking up from 199,000 previously but still within a stable range. Existing home sales registered at 4.02 million, slightly below expectations (4.05 million) and slightly above the prior 4.01 million, indicating a housing market that remains constrained yet steady.
Finally, rates and energy dynamics continued to reflect supply-side pressures. Treasury auctions cleared at higher yields, with the 10-year at 4.468% and the 30-year at 5.046%, while crude inventories declined by 4.3 million barrels, reinforcing tightening supply conditions and supporting near-term energy price pressures.
Economic and Capital Markets Dashboard
Week Ahead…

The upcoming week will shift focus toward early reads on May activity, labor conditions, and Fed communication, offering incremental clarity on whether growth remains resilient while policy expectations continue to evolve. Recent data has pointed to a mixed backdrop, with manufacturing showing relative strength while services activity remains modest, leaving markets focused on confirming whether growth is gradually cooling but still positive overall.
The week picks up on Wednesday with crude oil inventories, which will be closely watched following last week’s roughly 4.3-million-barrel draw. Continued tightening would reinforce supply-side pressures and could contribute to sustained firmness in energy prices. Later in the day, the release of the Federal Open Market Committee (FOMC) meeting minutes will provide additional insight into how policymakers are interpreting recent inflation data and balancing risks to growth. This should help refine expectations around the Fed’s policy path, particularly whether a higher-for-longer stance remains intact.
Attention then turns to Thursday, where the data flow broadens across labor, regional manufacturing, and forward-looking activity indicators. Initial jobless claims are expected near 210,000, a slight improvement from the prior 211,000 reading, and will serve as a timely gauge of labor market conditions. At the same time, the Philadelphia Fed Manufacturing Index is expected to decline to 17.9 from 26.7, pointing to some moderation while still indicating expansion. Preliminary Purchasing Managers’ Index (PMI) data will then provide an early look at May momentum, with manufacturing easing slightly and services holding near modest expansion levels, helping determine whether growth remains intact but gradually cooling.
Economic Indicators:
- CPI: Consumer Price Index measures the average change in prices paid by consumers for goods and services over time. Source: Bureau of Labor Statistics.
- Core CPI: Core Consumer Price Index excludes food and energy prices to provide a clearer picture of long-term inflation trends. Source: Bureau of Labor Statistics.
- PPI: Producer Price Index measures the average change in selling prices received by domestic producers for their output. Source: Bureau of Labor Statistics.
- Core PPI: Core Producer Price Index excludes food and energy prices to provide a clearer picture of long-term inflation trends. Source: Bureau of Labor Statistics.
- PCE: Personal Consumption Expenditures measure the average change in prices paid by consumers for goods and services. Source: Bureau of Economic Analysis.
- Core PCE: Core Personal Consumption Expenditures exclude food and energy prices to provide a clearer picture of long-term inflation trends. Source: Bureau of Economic Analysis.
- Industrial Production: Measures the output of the industrial sector, including manufacturing, mining, and utilities. Source: Federal Reserve.
- Mfg New Orders: Measures the value of new orders placed with manufacturers for durable and non-durable goods. Source: Census Bureau.
- Durable New Orders: Measures the value of new orders placed with manufacturers of durable goods. Source: Census Bureau.
- Durable Inventories: Measures the value of inventories held by manufacturers for durable goods. Source: Census Bureau.
- Consumer Confidence (CB, 1985=100): Measures the degree of optimism that consumers feel about the overall state of the economy and their personal financial situation. Source: Conference Board.
- ISM Manufacturing Report: Measures the economic health of the manufacturing sector based on surveys of purchasing managers. Source: Institute for Supply Management.
- ISM Non-Manufacturing Report: Measures the economic health of the non-manufacturing sector based on surveys of purchasing managers. Source: Institute for Supply Management.
- Leading Economic Index: Measures overall economic activity and predicts future economic trends. Source: Conference Board.
- Building Permits (Mil. of Units, saar): Measures the number of new residential building permits issued. Source: Census Bureau.
- Housing Starts (Mil. of Units, saar): Measures the number of new residential construction projects that have begun. Source: Census Bureau.
- New Home Sales (Mil. of Units, saar): Measures the number of newly constructed homes sold. Source: Census Bureau.
- SA: Seasonally adjusted.
- SAAR: Seasonally adjusted annual rate.
Market Indices & Indicators:
- S&P 500: A market-capitalization-weighted index of 500 leading publicly traded companies in the U.S., widely regarded as one of the best gauges of large U.S. stocks and the stock market overall.
- Dow Jones 30: Also known as the Dow Jones Industrial Average, it tracks the share price performance of 30 large, publicly traded U.S. companies, serving as a barometer of the stock market and economy.
- NASDAQ: The world’s first electronic stock exchange, primarily listing technology giants and operating 29 markets globally.
- Russell 1000 Growth: Measures the performance of large-cap growth segment of the U.S. equity universe, including companies with higher price-to-book ratios and growth metrics.
- Russell 1000 Value: Measures the performance of large-cap value segment of the U.S. equity universe, including companies with lower price-to-book ratios and growth metrics.
- Russell 2000: A market index composed of 2,000 small-cap companies, widely used as a benchmark for small-cap mutual funds.
- Wilshire 5000: A market-capitalization-weighted index capturing the performance of all American stocks actively traded in the U.S., representing the broadest measure of the U.S. stock market.
- MSCI EAFE Index: An equity index capturing large and mid-cap representation across developed markets countries around the world, excluding the U.S. and Canada.
- MSCI Emerging Market Index: Captures large and mid-cap representation across emerging markets countries, covering approximately 85% of the free float-adjusted market capitalization in each country.
- VIX: The CBOE Volatility Index measures the market’s expectations for volatility over the coming 30 days, often referred to as the “fear gauge.”
- FTSE NAREIT All Equity REITs: Measures the performance of all publicly traded equity real estate investment trusts (REITs) listed in the U.S., excluding mortgage REITs.
- S&P U.S. Aggregate Bond Index: Represents the performance of the U.S. investment-grade bond market, including government, corporate, mortgage-backed, and asset-backed securities.
- 3-Month T-bill Yield (%): The yield on U.S. Treasury bills with a maturity of three months, reflecting short-term interest rates.
- 10-Year Treasury Yield (%): The yield on U.S. Treasury bonds with a maturity of ten years, reflecting long-term interest rates.
- 10Y-2Y Treasury Spread (%): The difference between the yields on 10-year and 2-year U.S. Treasury bonds, often used as an indicator of economic expectations.
- WTI Crude ($/bl): The price per barrel of West Texas Intermediate crude oil, a benchmark for U.S. oil prices.
- Gold ($/Troy Oz): The price per troy ounce of gold, a standard measure for gold prices.
- Bitcoin: A decentralized digital currency without a central bank or single administrator, which can be sent from user to user on the peer-to-peer bitcoin network.
This content was developed by Cambridge from sources believed to be reliable. This content is provided for informational purposes only and should not be construed or acted upon as individualized investment advice. It should not be considered a recommendation or solicitation. Information is subject to change. Any forward-looking statements are based on assumptions, may not materialize, and are subject to revision without notice. The information in this material is not intended as tax or legal advice.
Investing involves risk. Depending on the different types of investments there may be varying degrees of risk. Socially responsible investing does not guarantee any amount of success. Clients and prospective clients should be prepared to bear investment loss including loss of original principal. Indices mentioned are unmanaged and cannot be invested into directly. Past performance is not a guarantee of future results.
The Dow Jones Industrial Average (DJIA) is a price-weighted index composed of 30 widely traded blue-chip U.S. common stocks. The S&P 500 is a market-cap weighted index composed of the common stocks of 500 leading companies in leading industries of the U.S. economy. The NASDAQ Composite Index is a market-value weighted index of all common stocks listed on the NASDAQ stock exchange.
Securities offered through Cambridge Investment Research, Inc., a broker-dealer, member FINRA/SIPC, and investment advisory services offered through Cambridge Investment Research Advisors, Inc., a Registered Investment Adviser. Both are wholly-owned subsidiaries of Cambridge Investment Group, Inc. V.CIR.0526-1825